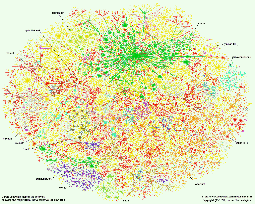
Here's a layout showing the major ISPs.

Following is a time series of three plots, colored by IP address. In the long run, we hope to make a movie of this data. At present, each is laid out separately and somewhat randomly, so destinations may appear in different places without actually having moved on the Internet:
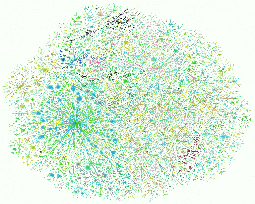 16 August 1998. |
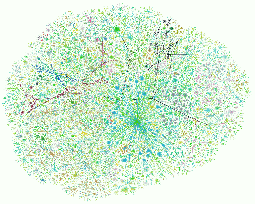 24 January 1999. |
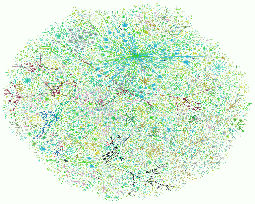 29 June 1999. |
We can use color to display different information on a given layout. The following data was collected on 3 May 1999.
Here are a number of maps colored by a single top-level domain, in no particular order.
.au
.jp
.cn
.nz
.in
.ca
.ar
.mx
.ch
.uk
.fr
.de
.fi
.nl
.ru
.yu
.mil
.edu
.gov
.org
This map appeared in the December 1998 Wired.If you are interested in using this image in some way, contact the folks at Lumeta, who own the rights to the images and technology.
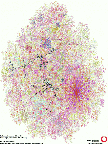
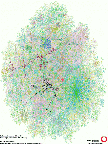
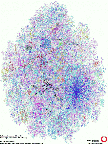
These are variations on the IP address-based color schemes, basically just switching around R, G, and B. These have the technical names of color schemes 0, 1, and 2.
Notes
Both my wife and Lillian Schwartz, a noted artist, say this is better with a black background. Easy to program, but we don't have black paper for the 36" plotter!Postscript and other higher-resolution versions are not available: they will be available commercially soon.
(A pookie is an arbitrary unit of distance in the space in which the maps are laid out.)